 EN
 DE
Turning Scattered Data into a Traceable Statement
Reporting greenhouse gas emissions involves more than entering figures into a spreadsheet. Organisations need to bring together information from sites, departments and, where relevant, their value chains. They must then be able to explain where the figures came from, how emissions were calculated and who reviewed the results.
A common challenge starts earlier in the process: data for Scope 1, Scope 2 and Scope 3 sits in different systems, files and formats. Missing information is discovered late. Different calculation methods make results difficult to compare. And where assumptions or changes are not documented, tracing a figure later takes additional work.
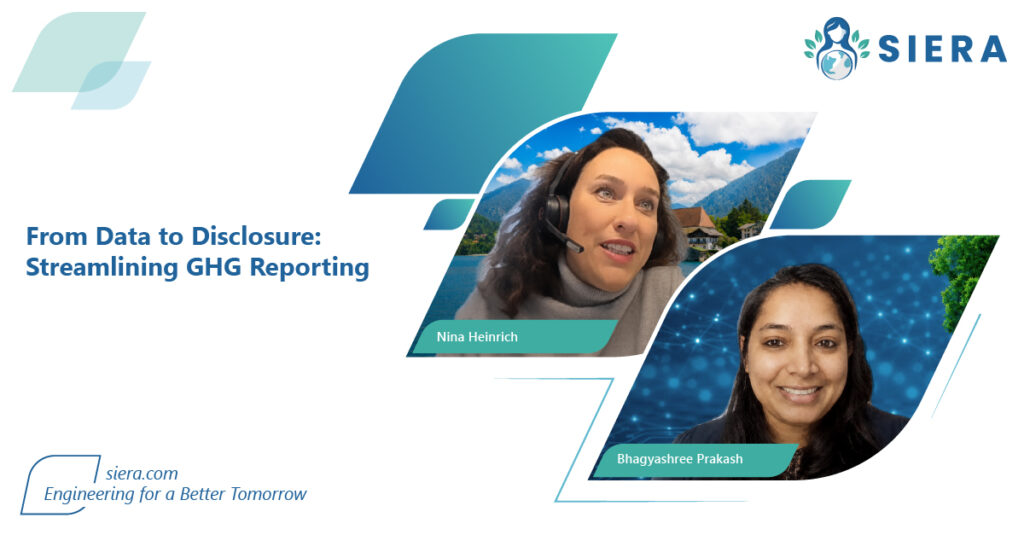
The SIERA Impact Series webinar “From Data to Disclosure: Streamlining GHG Reporting” explores these barriers. Using SIERA Core Impact as an example, it shows how a structured digital process can support greenhouse gas reporting—from data collection and calculation through review to disclosure.
Scope 1, 2 and 3: Three Perspectives on Emissions
Before preparing a report, an organisation must understand which emissions sources it will assess. The scopes provide a way to classify emissions by their origin:
- Scope 1 covers direct emissions from sources an organisation owns or controls.
- Scope 2 covers indirect emissions associated with purchased energy, such as electricity or heat.
- Scope 3 covers other indirect emissions across the value chain.
These categories provide structure, but they do not answer every data-collection question. Organisations first need to define their organisational and operational boundaries. The reporting period and any Scope 3 categories included must also fit the chosen methodology and be documented.
Scope 3 may require information from suppliers and other participants. Where data is unavailable, the approach used should be explained transparently. A central platform can make gaps visible; it cannot reliably create information that no one has collected.
Four Challenges Explored in the Webinar
The webinar presentation groups the challenges into four connected areas. For each, it presents an approach that can help teams structure their work.
| Challenge | Approach presented in the webinar | What teams still need to check |
| Fragmented and incomplete data | Central data collection and dashboards | Have all relevant sources and sites been included? |
| High manual effort | Standardised, partly automated calculations and reporting workflows | Do boundaries, factors and calculation methods fit the organisation? |
| Inconsistent data quality and methods | Digital collection and common templates | Are units, periods and inputs comparable? |
| Limited traceability | Records of sources, versions, checks and approvals | Can statements be supported with appropriate evidence? |
These approaches depend on one another. Central collection alone is insufficient if teams use different definitions. An automated calculation is only as reliable as its inputs and assumptions. And a completed report remains difficult to review if the route from source record to published figure is unclear.
Collect Data Centrally Without Losing Its Source
A shared data environment can make reconciliation across files and teams easier. Information from different functions can be brought together, compared and checked for gaps. Dashboards can then help reveal trends and possible emissions hotspots.
It remains essential to retain the origin of each figure. An energy consumption value, for example, should be linked to a site, a reporting period and a source. Changes to that value should also be traceable.
In its SIERA Core Impact example, the webinar connects central collection with Scope 1, 2 and 3 views. The potential benefit is not only quicker analysis. It is also a shared working record that participants can return to when questions arise.
Consistent Methods Instead of Conflicting Results
When business units use different units, emission factors or assumptions, their results may conflict—even when the underlying activities are similar.
A structured process therefore establishes:
- Which activity data is needed: such as consumption figures or other inputs relevant to calculation.
- Which units are used: so inputs can be compared.
- Which calculation method applies: including how emission factors are chosen and documented.
- How changes are handled: for example, corrected source data or updated assumptions.
- Who reviews the results: before they enter a disclosure.
The webinar presentation shows how digital templates, standardised surveys and calculation workflows can support this process. Professional review still matters when steps are automated. Software can apply a defined method consistently; selecting an appropriate method and understanding its limitations remain the reporting organisation’s responsibility.
Check Early Rather Than Correct Late
Missing information is particularly costly when it is discovered just before disclosure. Teams then need to request data, resolve differences and repeat calculations.
Digital collection forms and validation rules can help flag gaps or implausible inputs earlier. Common templates can also make coordination across sites, departments and suppliers easier.
Not every gap can be closed immediately. What matters is handling uncertainty clearly: Which information is available? What is missing? Where have estimates been used, and what assumptions support them? The answers are as important to a report’s quality as the emissions figures themselves.
From Calculation to Reviewable Disclosure
A result becomes traceable when someone else can understand how it was produced. That requires records of source data, calculation methods, versions, changes and internal approvals.
The webinar describes this connection as traceability from source to disclosure. SIERA Core Impact is presented as an example of digital workflows that connect figures, assumptions and supporting evidence.
The presentation also addresses reporting formats related to CSRD, ESRS and iXBRL. Whether these requirements apply to a particular organisation, and whether a specific disclosure meets them, must be assessed separately. A template or digital export is not automatic proof of regulatory compliance or successful assurance.
What a Structured Process Can Enable
When data, methods and responsibilities align, teams can spend less time reconciling conflicting spreadsheets. They can focus more on what the findings show: Where do emissions arise? Which trends are visible? Which questions require better data or further action?
The webinar identifies four potential benefits:
- Better-prepared reports: Figures can be built on a shared data foundation.
- Clearer insights: Dashboards can help reveal trends and emissions hotspots.
- Fewer avoidable errors: Common inputs and checks can reduce inconsistencies.
- More traceable evidence: Documented sources and approvals make it easier to answer review questions.
The scale of these benefits depends on an organisation’s starting point, data quality and implementation. The webinar slides include general percentages about possible efficiency gains and data-collection challenges, but do not provide traceable sources for them. This article therefore does not present those figures as verified findings.
A Practical Place to Start
An organisation does not need to change its entire reporting process at once. One useful starting point is to examine an existing dataset or recurring request: Where is the data held? Who supplies it? Which definitions are used? Where is evidence missing?
That review can inform a workflow suited to the organisation’s responsibilities. Digital support is most useful when it makes that workflow clearer—not when it simply moves unresolved data questions into a new system.
The webinar’s connection between collection, calculation, review and documentation highlights the central principle: a reliable greenhouse gas disclosure is built from verifiable information and consistent decisions, not just a finished chart.
CTA
Do you want to turn scattered emissions data into a traceable reporting process? Contact @SIERA to discuss how data collection, calculation, review and disclosure could be structured for your needs. For questions about the webinar, email info@siera.com.
Engineering for a Better Tomorrow